Counting and Basic Frequency Plots
Counting is an essential task required for most analysis projects. The ability to take counts and visualize them graphically using frequency plots (histograms) enables the analyst to easily recognize patterns and relationships within the data. Good news is this can be accomplished using python with just 1 line of code!
import pandas as pd
%matplotlib inline

df = pd.read_csv('iris-data.csv') #toy dataset
df.head()
| sepal_length_cm | sepal_width_cm | petal_length_cm | petal_width_cm | class | |
|---|---|---|---|---|---|
| 0 | 5.1 | 3.5 | 1.4 | 0.2 | Iris-setosa |
| 1 | 4.9 | 3.0 | 1.4 | 0.2 | Iris-setosa |
| 2 | 4.7 | 3.2 | 1.3 | 0.2 | Iris-setosa |
| 3 | 4.6 | 3.1 | 1.5 | 0.2 | Iris-setosa |
| 4 | 5.0 | 3.6 | 1.4 | 0.2 | Iris-setosa |
df['class'][:5]
0    Iris-setosa
1    Iris-setosa
2    Iris-setosa
3    Iris-setosa
4    Iris-setosa
Name: class, dtype: object
Frequency Plot for Categorical Data
df['class'].value_counts() #generate counts
Iris-virginica     50
Iris-setosa        49
Iris-versicolor    45
versicolor          5
Iris-setossa        1
Name: class, dtype: int64
Notice that the value_counts() function automatically provides the classes in decending order. Let's bring it to life with a frequency plot.
df['class'].value_counts().plot()

I think a bar graph would be more useful, visually.
df['class'].value_counts().plot('bar')

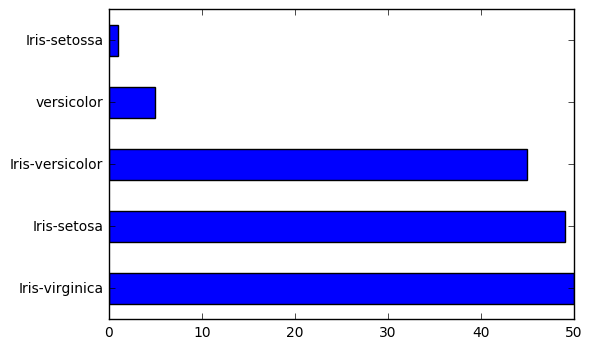
df['class'].value_counts().plot('barh') #horizontal bar plot
df['class'].value_counts().plot('barh').invert_yaxis() #horizontal bar plot
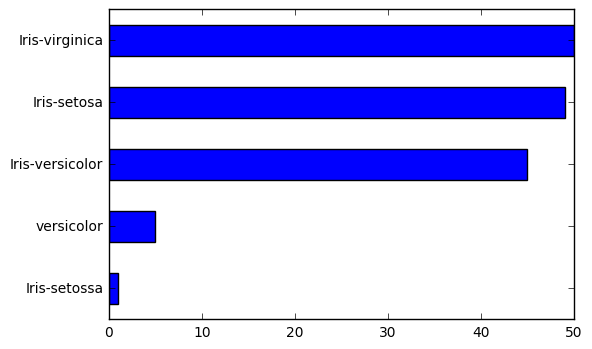
There you have it, a ranked bar plot for categorical data in just 1 line of code using python!
Histograms for Numberical Data
You know how to graph categorical data, luckily graphing numerical data is even easier using the hist() function.
df['sepal_length_cm'].hist() #horizontal bar plot
df['sepal_length_cm'].hist(bins = 30) #add granularity

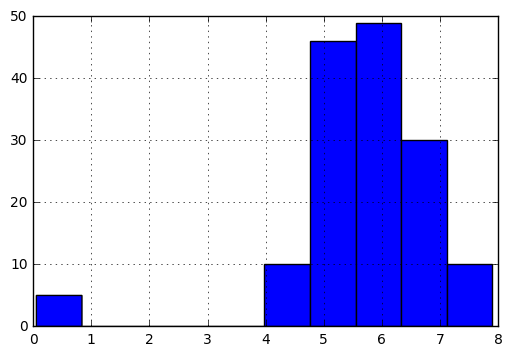
df['sepal_length_cm'].hist(bins = 30, range=[4, 8]) #add granularity & range
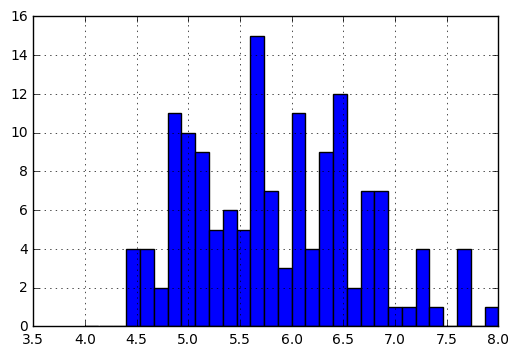
df['sepal_length_cm'].hist(bins = 30, range=[4, 8], facecolor='gray') #add granularity & range & color
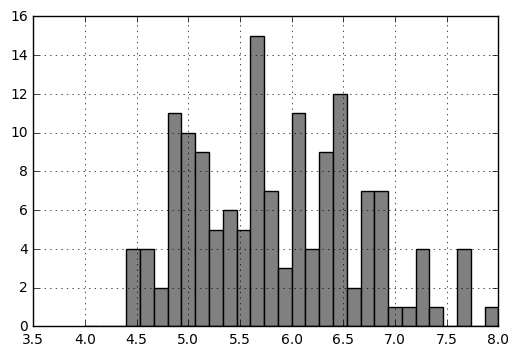
There you have it, a stylized histogram for numerical data using python in 1 compact line of code.